Скачать с ютуб Identification of Culprit Vessel From ECG в хорошем качестве
Identification of Culprit Vessel From ECG
3 года назад
Скачать бесплатно Identification of Culprit Vessel From ECG в качестве 4к (2к / 1080p)
У нас вы можете посмотреть бесплатно Identification of Culprit Vessel From ECG или скачать в максимальном доступном качестве, которое было загружено на ютуб. Для скачивания выберите вариант из формы ниже:
Загрузить музыку / рингтон Identification of Culprit Vessel From ECG в формате MP3:
Если кнопки скачивания не
загрузились
НАЖМИТЕ ЗДЕСЬ или обновите страницу
Если возникают проблемы со скачиванием, пожалуйста напишите в поддержку по адресу внизу
страницы.
Спасибо за использование сервиса savevideohd.ru
Identification of Culprit Vessel From ECG
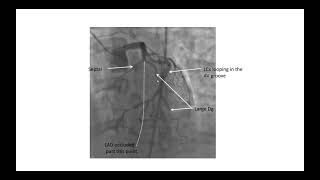
Discussion on identification of culprit vessel or infarct artery localization. Have a look at this ECG and the associated angiogram. The ECG shows ST segment elevation in leads II, III and aVF of about 3mm. ST segment depression is seen in leads I, aVL and V1 to V5. Overall features are suggestive of hyperacute phase of inferior wall myocardial infarction with “reciprocal” ST segment depression in anterior leads. Left coronary angiogram shows total occlusion of distal left circumflex coronary artery with absent dye filling in a short segment (black arrow). Multiple significant lesions are seen in left anterior descending coronary artery (blue arrows). Significant lesions are also seen in the obtuse marginal branch of the left circumflex coronary artery (yellow arrows). The culprit lesion which has caused the infarction in this case is possibly the left circumflex occlusion. Generally, the ST elevation is more in lead III in right coronary occlusion while it is more in lead II in left circumflex occlusion. In this case, we have almost equal ST elevation in leads II and III. But the discussion does not stop there. Right coronary angiogram shows a critical lesion (black arrow) with some negative shadows distal to the lesion, suggesting thrombus. We may be tempted to believe that this is the culprit lesion which has caused the inferior wall infarction if the LCX lesion was not found. This case demonstrates a limitation of localization of culprit vessel from ECG. Here is another similar ECG. But there is mild ST elevation in V5 and V6, in addition to inferior ST elevation, which makes left circumflex lesion more likely. aVL shows minimal ST depression. So does V1 and V2. In this ECG, ST segment elevation and T wave inversion are present in II, III and aVF, the inferior leads. The ST segment is coved, and T waves are inverted in V5 and V6, the lateral leads. Minimal ST segment depression is seen in lead I and aVL, which can be taken as reciprocal to the ST segment elevation in inferior leads. There are tall R waves in V1 and V2 with R/S ratio more than 1, and ST segment depression with upright T waves. These features are suggestive of posterior wall infarction, being the inverse of Q wave, ST elevation and T wave inversion which would have been recorded in a posterior lead. There is also loss of r wave amplitude in V5, V6. Together with the changes in inferior and lateral leads, the full diagnosis is inferior, posterior, and lateral wall infarction. This combination can occur in occlusion of a dominant left circumflex coronary artery which supplies the inferior, posterior, and lateral walls of the left ventricle. The angiograms discussed in the first case had an occlusion of a dominant left circumflex coronary artery. Right coronary artery was small and non-dominant. The full extent of supply by left circumflex can only be seen after opening the occlusion. Left coronary angiogram, showing dominant left circumflex with left posterior descending artery arising from it (LPDA). Here it is a non-dominant left circumflex, and it gives only obtuse marginal branches and no LPDA. This is how a dominant RCA will look like, much larger and giving rise to posterior descending and posterior left ventricular branches. Right ventricular branches are also seen. If there is a proximal occlusion, inferior wall infarction is associated with right ventricular infarction. RV infarction manifests with ST elevation in right precordial leads. Right precordial ST elevation can also occur in anterior wall infarction due to left anterior descending artery occlusion. But in LAD occlusion, ST elevation in V2 is more than that in V1. In right ventricular infarction, more ST elevation is noted in V3R than in V1. V1 can show ST elevation in both these cases. Now what about this ECG? ECG shows sinus rhythm at around 100/min, with ST segment elevation in aVR and V1. ST depression is seen in I, II, III, aVF, V3-V5. Maximum ST depression is noted in V4 and V5 and it is down sloping. Duration of ST elevation in aVR is more than that in V1. Overall, it is likely to be due to left main coronary artery disease. Alternate option is proximal multivessel coronary stenosis. But proximal left anterior descending coronary artery stenosis should have produced some ST elevation in V2. Here ST segment is isoelectric in V2. This is another ECG from a person with persistent anginal pain for the past several hours showing significant ST segment depression in anterolateral leads along with sinus tachycardia. ST segment elevation is noted in aVR. Such a pattern is consistent with significant left main coronary artery stenosis. Clinical evaluation and X-Ray chest showed features of pulmonary edema. Angiography done after initial stabilization with intensive medical management showed severe stenosis of distal left main coronary artery along with multiple lesions in all the three vessels.
Comments